Reports

In order to effectively reduce energy costs, we must first understand what pieces of equipment are working for us, and which are working against us. Central plant monitoring and trending has been around for some time now and the ability to collect raw data is endless. Chillers and boilers are at the heart of every central plant, yet the ability to reliably evaluate their financial performance has been elusive at best. . CSE developed ACT to bridge the gap between raw data collection and using that data to produce a result of real time energy consumption in dollars. This data is then archived for any future evaluation of central plant performance.
ACT utilizes the data collected to provide the user with a wealth of information in a variety of useful formats. By simply pointing and clicking on filter items, the user can review detailed information, thus allowing that user to make educated financial and operational decisions about their central plant.
Report Builder
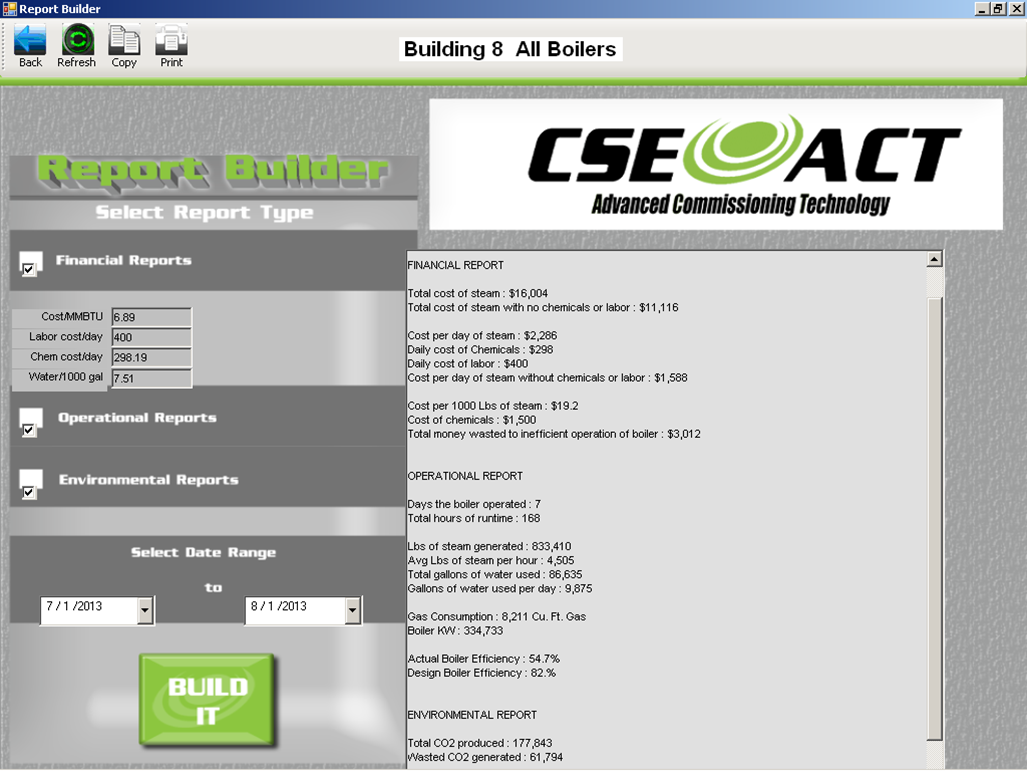
![]() ACT has a user friendly Report Builder that encompasses operational data, financial data, and environmental data. The user simply selects date ranges to make the search specific and within seconds the information is bundled into an easy to read and utilize format. The user can also take the reporting one step further by adding in site specific costs such as gas and labor with the result being a complete financial snapshot.
ACT has a user friendly Report Builder that encompasses operational data, financial data, and environmental data. The user simply selects date ranges to make the search specific and within seconds the information is bundled into an easy to read and utilize format. The user can also take the reporting one step further by adding in site specific costs such as gas and labor with the result being a complete financial snapshot.
Calc
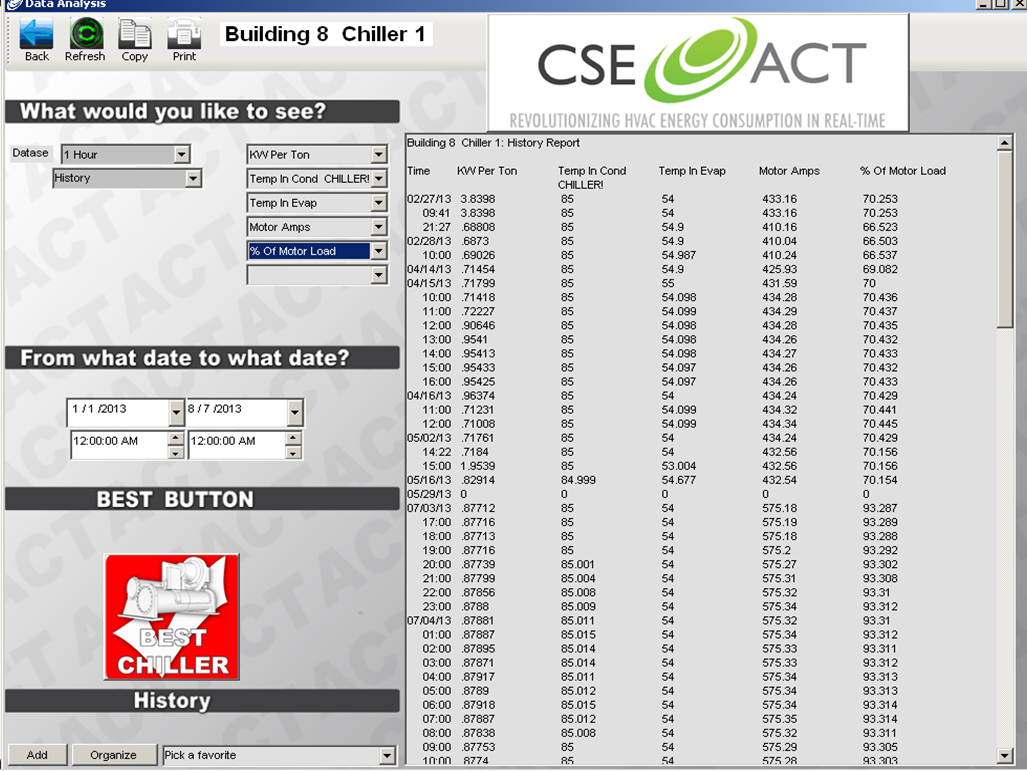
![]() In the Calc option of ACT the user is able to review operational and financial information from 5 minute increments up to 1 month increments and for any time frame specified. The user is able to review the History, Averages, Costs, and Alarms on items such as Steam Pressure PSIG, Stack Temp, Boiler Efficiency and much more.
In the Calc option of ACT the user is able to review operational and financial information from 5 minute increments up to 1 month increments and for any time frame specified. The user is able to review the History, Averages, Costs, and Alarms on items such as Steam Pressure PSIG, Stack Temp, Boiler Efficiency and much more.
Graph
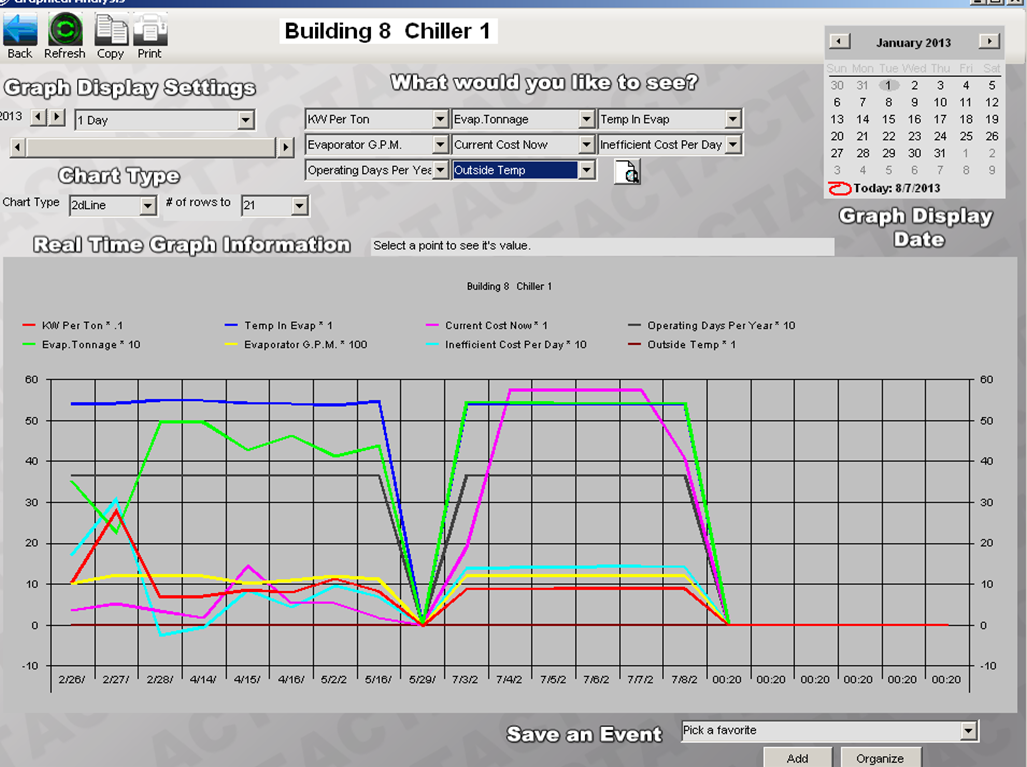
 The Graph option in ACT allows the user to review operational and financial data in a variety of graph formats from 5 second increments to 1 month increments and for any time frame specified. The user also has the ability to “Save an Event” within ACT to immediately capture and save information that’s noteworthy. That data is then easily accessible as it will have it’s own title, that the user designated, within the drop down.
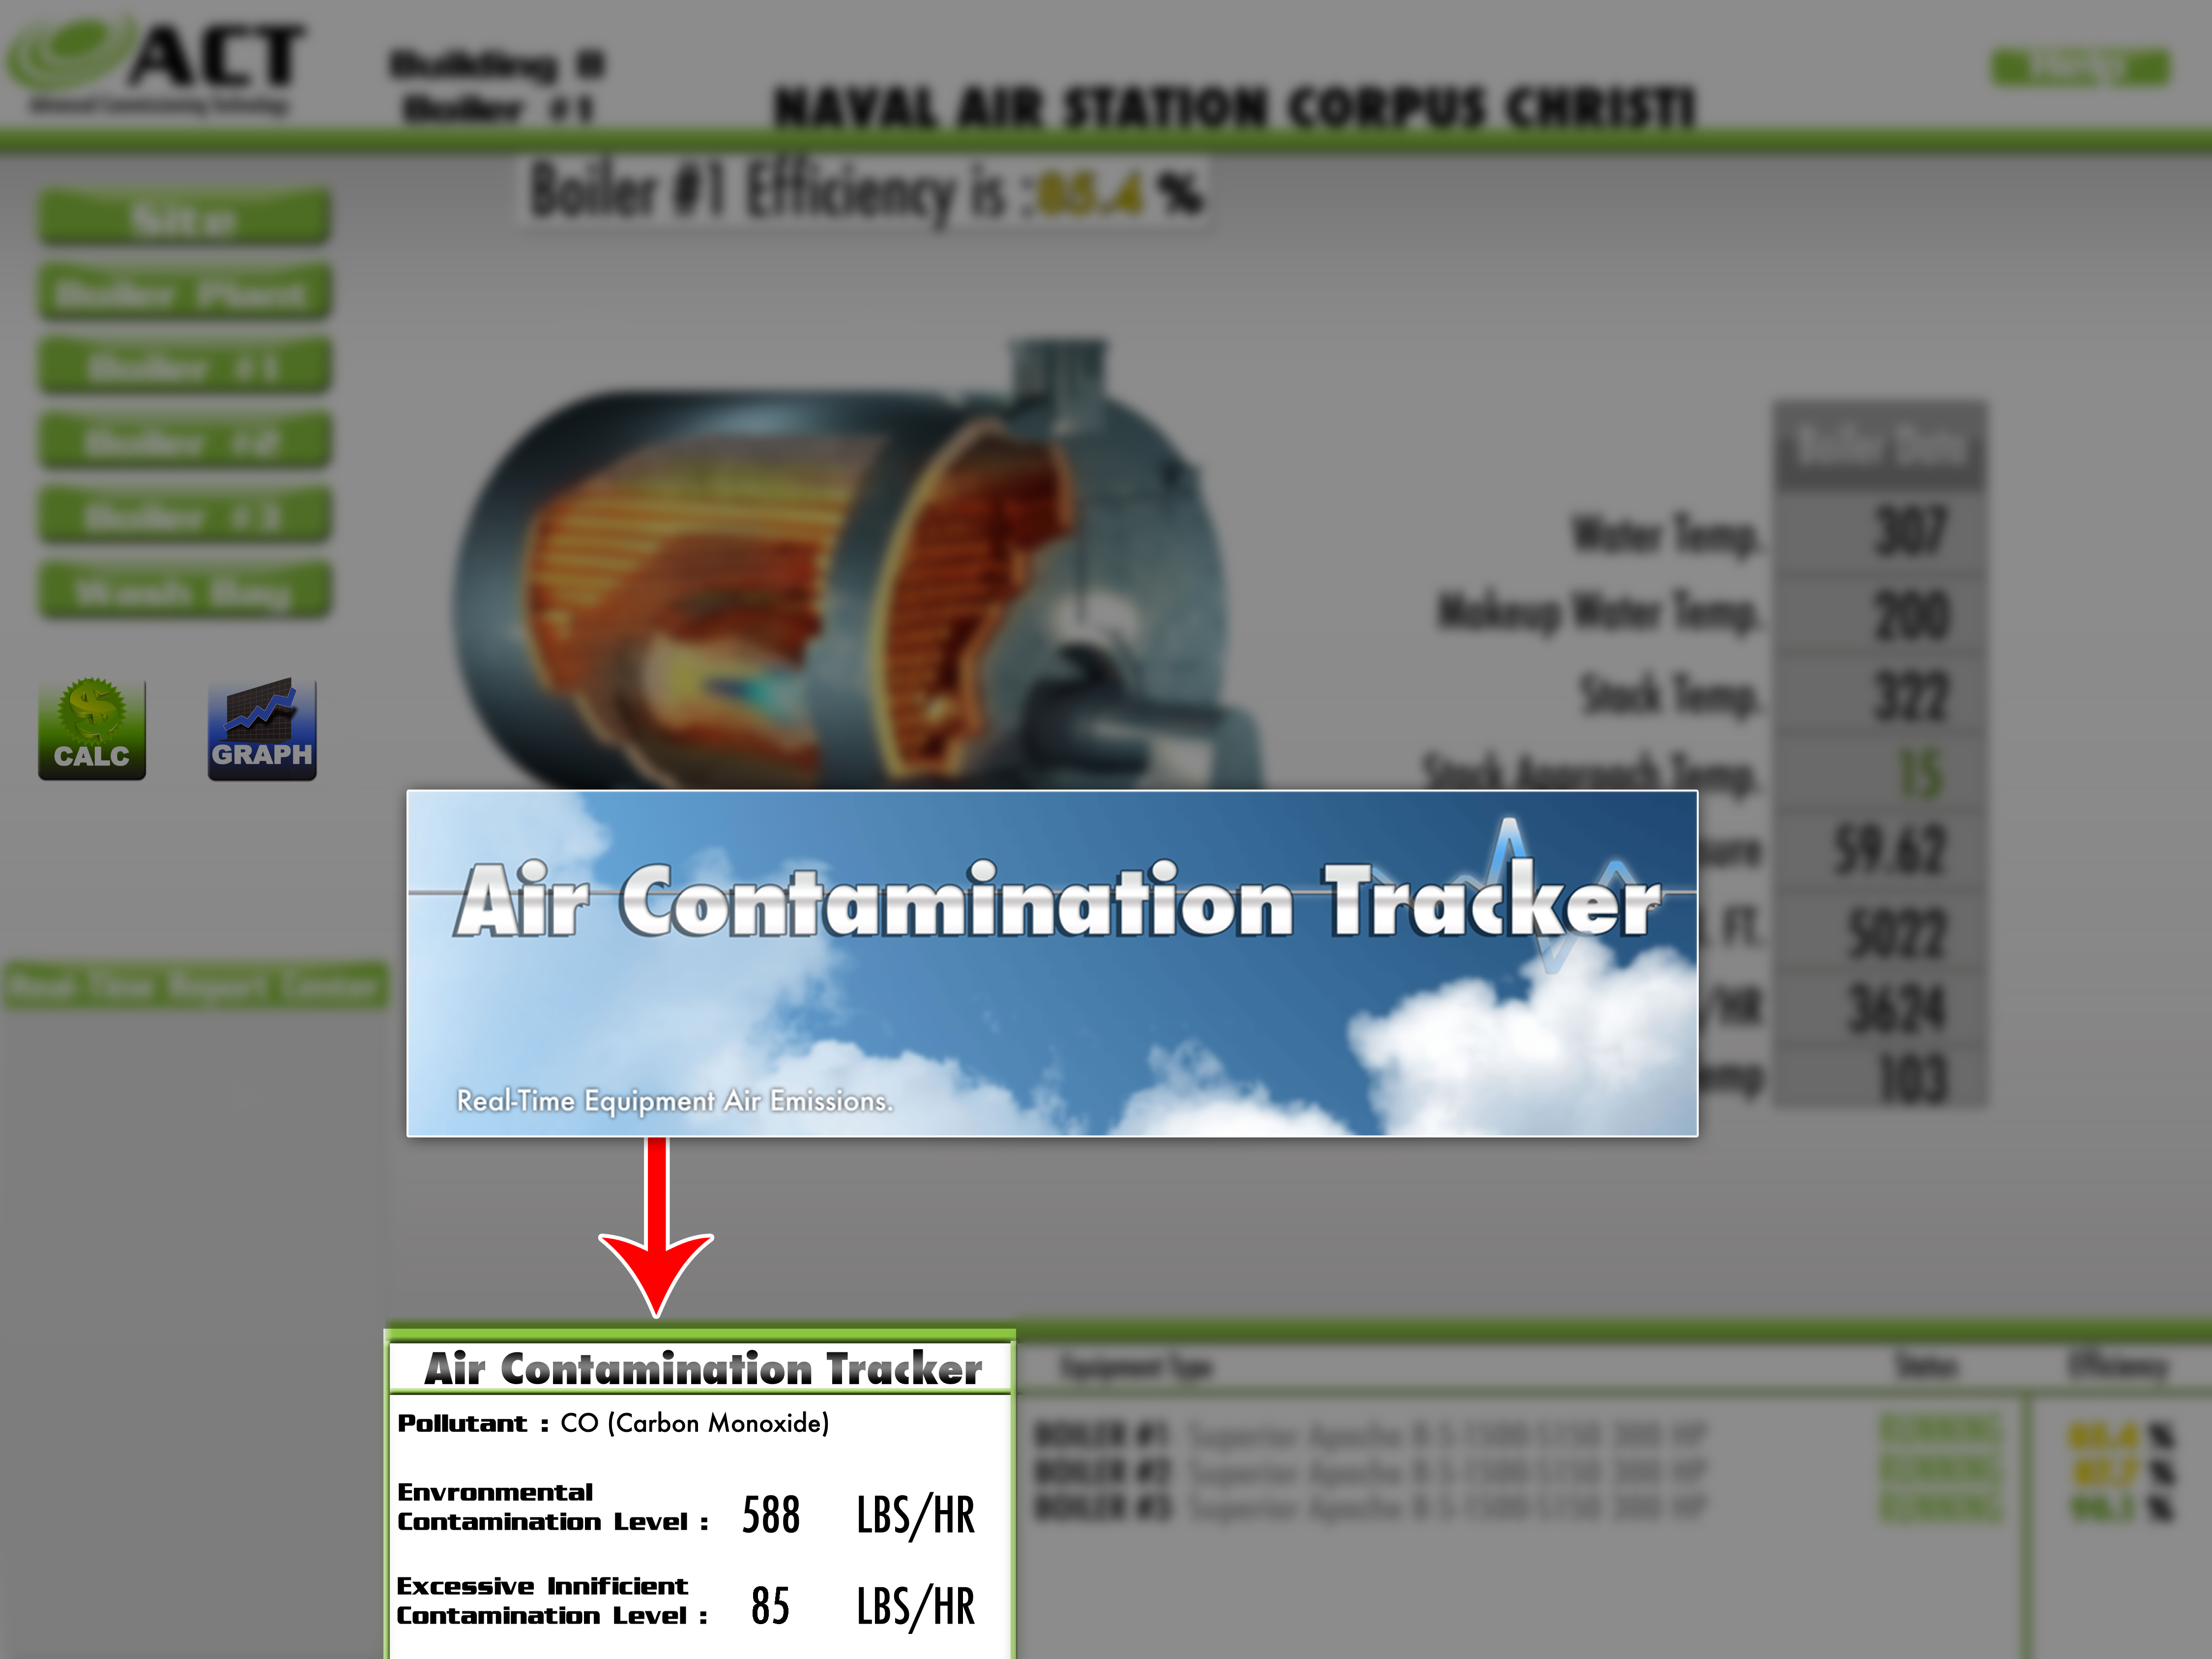
Contamination Tracker
ACT also provides a variety of Environmental Reports that reside within the Calc and Graph options. The Air Contamination Tracker, which displays the Environmental Contamination Level and the Excessive Inefficient Contamination Level, is shown in several locations within ACT so the user has the information readily available